Cần có kiến thức cơ bản về docker như image, container docker-compose, volumes, port, service,... và có đọc trước một chút về Prometheus và Grafana. Có 2 cách cài đặt các service trong hệ thống Prometheus là cài bằng tay (download package hoặc build source code,...) hoặc dùng các container (docker).
Bài viết sử dụng docker để cài đặt.
OS: Centos 8
- Cài đặt Prometheus và Grafana
- Cài đặt SNMP Exporter (Prometheus) để giám sát các thiết bị mạng
- Cài đặt Alert Manager (Prometheus) để gửi mail khi có cảnh báo
1. Tổng quan
Hệ thống Prometheus có 2 phần là Prometheus Server và các Node Exporter. Prometheus Server sẽ chủ động scrape các dữ liệu (metrics) được xuất ra bởi các Node Exporter. Các Exporter sẽ được cài trên các máy chủ cần giám sát và được cung cấp bởi bên thứ ba.
Do Prometheus không mạnh lắm về visualize các metrics, nên thông thường người ta sử dụng Grafana kèm theo Prometheus để visualize.
2. Pull Image
docker pull prom/prometheus
docker pull grafana/grafana
3. prometheus.yml
File này dùng để cấu hình các node (windows server, linux server,...) cần monitor (theo dõi). Các node trong file này được định nghĩa ở targets.
Sau khi cài exporter cho node nào đó thì phải thêm vào file này và start lại prometheus.
global:

  scrape_interval: 10s

scrape_configs:

  - job_name: prometheus

    scrape_interval: 5s

    static_configs:

      - targets:

          - 'localhost:9090'

  - job_name: windows-test

    scrape_interval: 5s

    static_configs:

      - targets:

          - '192.168.34.75:9182'

  - job_name: web

    scrape_interval: 5s

    static_configs:

      - targets:

          - '10.0.40.55:9182'

        labels:

          hostname: test-web

          type: windows
4. Windows Exporter
Để export các Metrics (thông số) trên Windows cho Prometheus Server, thì cần có 1 Service gọi là Node Exporter. Trong Windows thì gọi là Windows Exporter. .
Service này chạy ở port 9182, nên phải ở port 9182 trên Firewall của Windows, và Firewall trong hệ thống mạng (nếu có).
Link download exporter
Trong đường dẫn có 2 định dạng, nếu chạy luôn thì dùng .exe, còn không thì dùng msi.
Nếu chọn .msi, thì run cmd với quyền admin, sau đó chạy lệnh dưới.
msiexec /i C:\Prometheus\windows_exporter-0.18.1-amd64.msi ENABLED_COLLECTORS="ad,cpu,cs,logon,memory,logical_disk,os,service,system,process,tcp,net,textfile,thermalzone,iis"
Nếu thành công thì khi vào http://localhost:9182/metrics sẽ thấy hiện lên các thông số
5. Run docker-compose
Tạo file docker-compose.yml có nội dung dưới đây
version: '3.7'
services:
  prometheus:

    image: prom/prometheus

    volumes:

      - /etc/prometheus-docker/prometheus.yml:/etc/prometheus/prometheus.yml

    ports:

      - 9090:9090

    restart: always
  grafana:

    image: grafana/grafana

    user: "0"

    ports:

      - 3000:3000

    volumes:

      - /var/lib/grafana/data:/var/lib/grafana

      - /var/lib/grafana/provisioning:/etc/grafana/provisioning

    restart: always
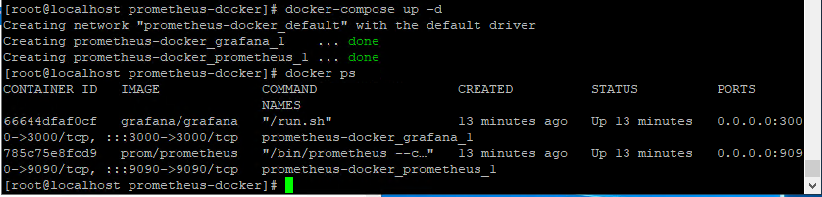
Sau đó run
docker-compose up -d
Kết quả:
Truy cập Grafana bằng [IP]:3000 với tài khoản mặc định là admin/admin, và truy cập Prometheus bằng [IP]:9090.
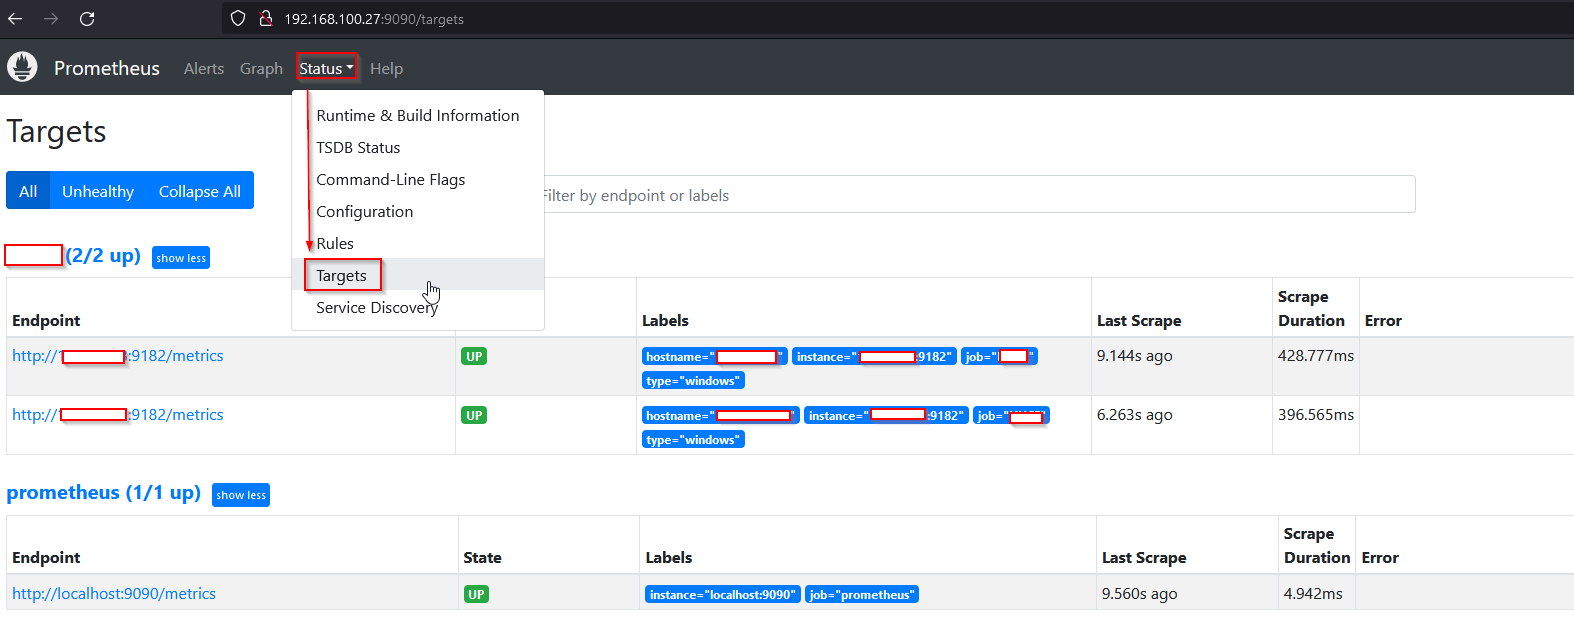
Hình ảnh sau của Prometheus Server sau khi chạy thành công
6. Grafana
Truy cập https://grafana.com/grafana/dashboards/ và tìm mã dashboard thích hợp.
Nếu không có dashboard nào ưng ý thì có thể tự tùy biến thêm. Trong ví dụ đã tìm được 2 mã 14510, 13866.
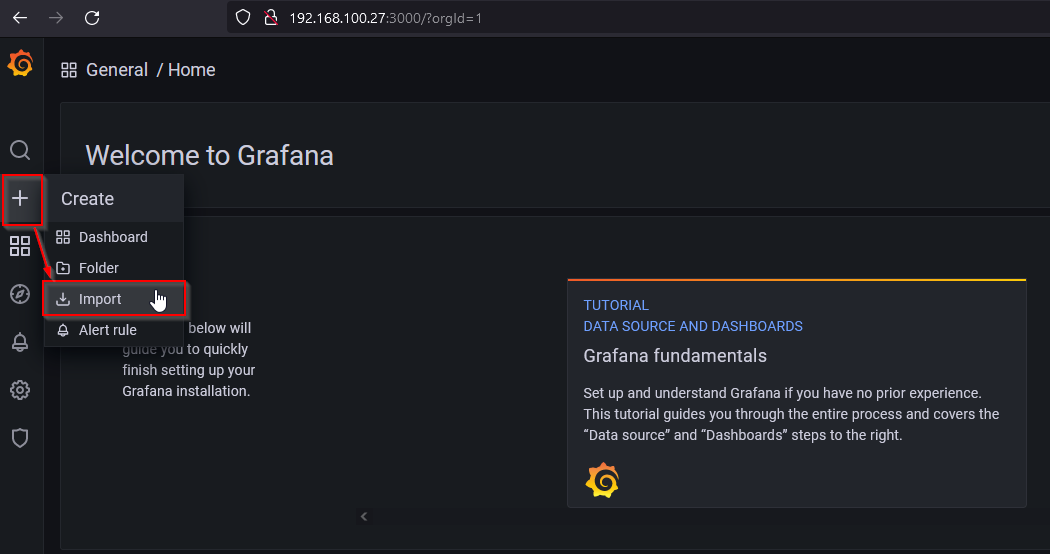
Các hình dưới đây minh họa cho việc import dashboard
7. Kết quả
Cần có kiến thức cơ bản về docker như image, container docker-compose, volumes, port, service,... và nắm được file mib, snmp, lệnh linux căn bản
OS: Centos 8
- Cài đặt Prometheus và Grafana
- Cài đặt SNMP Exporter (Prometheus) để giám sát các thiết bị mạng
- Cài đặt Alert Manager (Prometheus) để gửi mail khi có cảnh báo
1. Tổng quan
Chức năng của VmWare Exporter là export ra các thông số (metrics) của máy chủ đang sử dụng ESXI. Sau đó Prometheus Server sẽ scrape các thông số này và đẩy sang cho Grafana visualize thành các đồ thị.
Như vậy công việc cần làm là
- Cài đặt và cấu hình Vmware Exporter
- Cấu hình Prometheus để scrape data từ Vmware Exporter
- Tạo dashboard giám sát trên Grafana
2. Vmware Exporter
Trong bài viết sử dụng exporter tại đường dẫn https://github.com/pryorda/vmware_exporter. (Có thể sử dụng các vmware exporter khác nếu muốn, vd: https://github.com/devinotelecom/prometheus-vmware-exporter).
Pull Image về:
docker pull docker pull pryorda/vmware_exporter
Tạo file config.yml cho exporter có nội dung như bên dưới (Có thể tạo ở đâu cũng được, trong bài viết là /etc/prometheus-docker/vmware_exporter/config.yml):
vi /etc/prometheus-docker/vmware_exporter/config.yml
default:
vsphere_host: "192.168.10.5"
vsphere_user: "monitor"
vsphere_password: "123456"
ignore_ssl: True
specs_size: 5000
fetch_custom_attributes: True
fetch_tags: True
fetch_alarms: True
collect_only:
vms: True
vmguests: True
datastores: True
hosts: True
snapshots: True
esxi1:
vsphere_host: "192.168.10.6"
vsphere_user: "monitor"
vsphere_password: "123456"
ignore_ssl: True
specs_size: 5000
fetch_custom_attributes: True
fetch_tags: True
fetch_alarms: True
collect_only:
vms: True
vmguests: True
datastores: True
hosts: True
snapshots: True
Lưu ý: config.yml yêu cầu phải có default, còn các host còn lại đặt tên gì cũng được.
3. Điều chỉnh cấu hình của Prometheus
Add thêm nội dung như sau để Prometheus Server scrape được metrics của Vmware Exporter
################################ VMWARWE
- job_name: 'esxi-1'
metrics_path: '/metrics'
static_configs:
- targets:
- "192.168.10.5"
labels:
hostname: ESXI-1
type: esxi-host
params:
section: [default]
relabel_configs:
- source_labels: [__address__]
target_label: __param_target
- source_labels: [__param_target]
target_label: instance
- target_label: __address__
replacement: 192.168.10.2:9272
- job_name: 'esxi-2'
metrics_path: '/metrics'
static_configs:
- targets:
- "192.168.10.6"
labels:
hostname: ESXI-2
type: esxi-host
params:
section: [esxi1]
relabel_configs:
- source_labels: [__address__]
target_label: __param_target
- source_labels: [__param_target]
target_label: instance
- target_label: __address__
replacement: 192.168.100.2:9272
Lưu ý: section phải khớp với tên host đã được định nghĩa trong file config.yml
4. Start hệ thống
Thêm nội dung sau cho file docker-compose.yml
vmware-exporter:
image: pryorda/vmware_exporter
restart: unless-stopped
ports:
- 9272:9272
volumes:
- /etc/prometheus-docker/vmware_exporter/config.yml:/opt/vmware_exporter/config.yml
command: -c /opt/vmware_exporter/config.yml
Start
docker-compose up -d
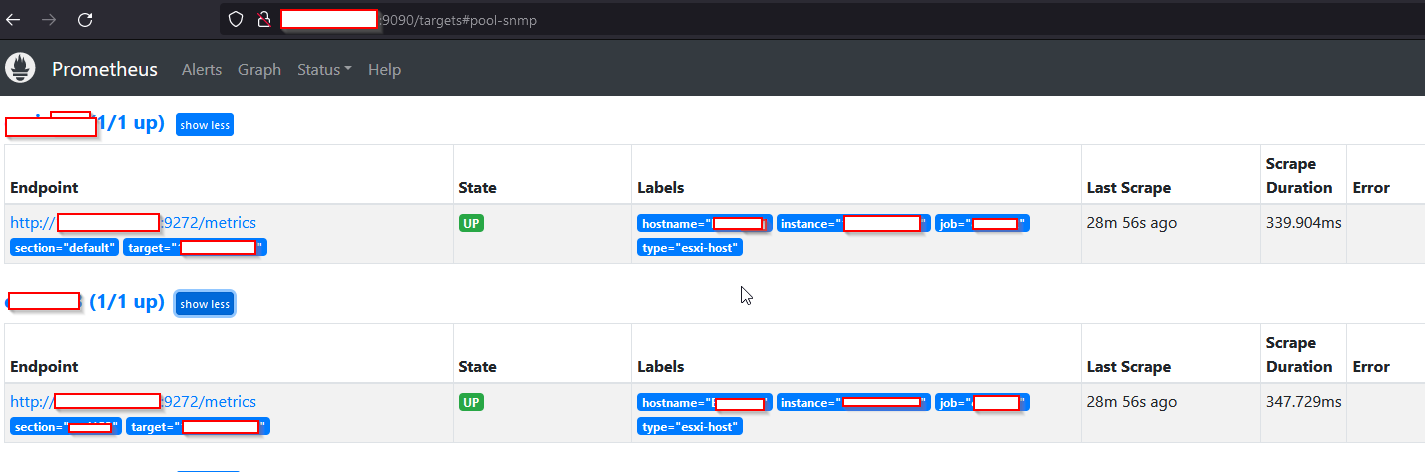
Truy cập [IP]:9272 để xem metrics từ vmware exporter và [IP]:9090 để xem prometheus (Status > Targets)
5. Tạo dashboard trên Grafana
Truy cập đường dẫn https://grafana.com/grafana/dashboards để tìm dashboard phù hợp. Trong bài viết chọn dashboard mã 7502 vì có hỗ trợ Vmware Exporter vừa cài đặt.
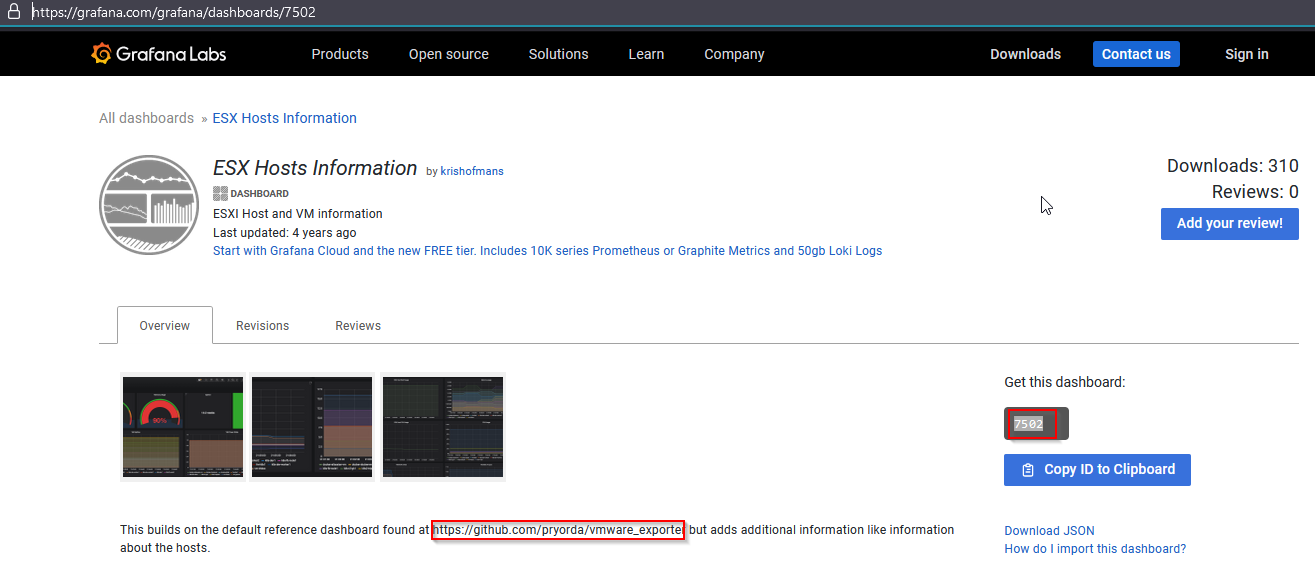
Kết quả sau khi tạo dashboard
Cần có kiến thức cơ bản về docker như image, container docker-compose, volumes, port, service,...
OS: Centos 8
- Cài đặt Prometheus và Grafana
- Cài đặt SNMP Exporter (Prometheus) để giám sát các thiết bị mạng
- Cài đặt Alert Manager (Prometheus) để gửi mail khi có cảnh báo
1. Tổng quan
Alert trong Prometheus được chia làm 2 phần là Rule trong Prometheus Server và Alert Manager.
Rule có 3 trạng thái là inactive, pending, firing. Prometheus Server sẽ check các rule này, nếu thỏa mãn điều kiện thì sẽ đẩy sang cho Alert Manager xử lý. Alert Manager sẽ gửi quản lý các alert vừa nhận, gửi thông báo qua các kênh mail, chat,...
Vậy nên sẽ phải cấu hình các Rule ở Prometheus Server, cấu hình kết nối Prometheus Server và Alert Manager và cấu hình cho AlertManager để xử lý alert.
2. Pull Image
dockker pull prom/alertmanager
3. docker-compose.yml
Tạo 2 thư mục /etc/prometheus-docker/alertmanager/config, /etc/prometheus-docker/alertmanager/data
mkdir -p /etc/prometheus-docker/alertmanager/data
Trong file docker-compose.yml, add thêm nội dung bên dưới để start Alert Manager:
  alertmanager:

    image: prom/alertmanager

    restart: unless-stopped

    ports:

      - 9093:9093

    volumes:

      - /etc/prometheus-docker/alertmanager/config:/config

      - /etc/prometheus-docker/alertmanager/data:/data

    command: --config.file=/config/alertmanager.yml --log.level=debug
4. prometheus.yml
Trong file prometheus.yml, add thêm đoạn bên dưới để cấu hình kết nối với Alert Manager và cấu hình tên file chứa rule.
alerting:

  alertmanagers:

    - static_configs:

      - targets:

          - "192.168.100.27:9093"

rule_files:

      - "windows-rule.yml"
Rule sẽ tạo ở bước sau.
5. Tạo file rule
Các file rule sẽ có định dạng yml và được đặt ngang cấp với file prometheus.yml. Có thể tạo nhiều file rule (vd: windows-rule.yml, cisco-rule.yml, linux-rule.yml, fortigate.yml,...)
Prometheus Server sẽ đọc các Rule được định nghĩa ở đây. Bên dưới là 1 ví dụ định nghĩa rule cho windows:
############# Define Rule Alert ###############

# my global config

############# Define Rule Alert ###############

groups:

- name: Windows-alert

  rules:
################ Memory Usage High

  - alert: Memory Usage High

    expr: 100*(windows_cs_physical_memory_bytes)*0 < 1

    for: 1m

    labels:

      severity: warning

    annotations:

      summary: "Memory Usage (instance {{ $labels.instance }})"

      description: "Memory Usage is more than 90%\n  VALUE = {{ $value }}\n  LABELS: {{ $labels }}"
################ CPU Usage High

  - alert: Cpu Usage High

    expr: 100 - (avg by (instance) (irate(wmi_cpu_time_total{mode="idle"}[2m])) * 100) > 80

    for: 1m

    labels:

      severity: warning

    annotations:

      summary: "CPU Usage (instance {{ $labels.instance }})"

      description: "CPU Usage is more than 80%\n  VALUE = {{ $value }}\n  LABELS: {{ $labels }}"
################ Disk Usage

  - alert: DiskSpaceUsage

    expr: 100.0 - 100 * ((wmi_logical_disk_free_bytes{} / 1024 / 1024 ) / (wmi_logical_disk_size_bytes{}  / 1024 / 1024)) > 95

    for: 1m

    labels:

      severity: error

    annotations:

      summary: "Disk Space Usage (instance {{ $labels.instance }})"

      description: "Disk Space on Drive is used more than 95%\n  VALUE = {{ $value }}\n  LABELS: {{ $labels }}"
################ ServiceStatus

  - alert: ServiceStatus

    expr: wmi_service_status{status="ok"} != 1

    for: 1m

    labels:

      severity: error

    annotations:

      summary: "Service Status (instance {{ $labels.instance }})"

      description: "Windows Service state is not OK\n  VALUE = {{ $value }}\n  LABELS: {{ $labels }}"
################ CollectorError

  - alert: CollectorError

    expr: wmi_exporter_collector_success == 0

    for: 1m

    labels:

      severity: error

    annotations:

      summary: "Collector Error (instance {{ $labels.instance }})"

      description: "Collector {{ $labels.collector }} was not successful\n  VALUE = {{ $value }}\n  LABELS: {{ $labels }}"
6. alertmanager.yml
Ở bước 3, có dòng --config.file=/config/alertmanager.yml, tức là sẽ phải tạo file alertmanager.yml nằm ở /etc/prometheus-docker/alertmanager/config
vi /etc/prometheus-docker/alertmanager/config/alertmanager.yml
Sau đó add nội dung bên dưới
global:

  resolve_timeout: 5m
route:

  group_by: ['alertname']

  group_wait: 10s

  group_interval: 10s

  repeat_interval: 3600s

  receiver: 'email'

receivers:

- name: 'email'

  email_configs:

  - to: 'to@gmail.com'

    from: 'from@gmail.com'

    smarthost: 'smtp.gmail.com:587'

    auth_username: 'from@gmail.com'

    auth_identity: 'from@gmail.com'

    auth_password: 'abcbs12123'
7. Kết quả
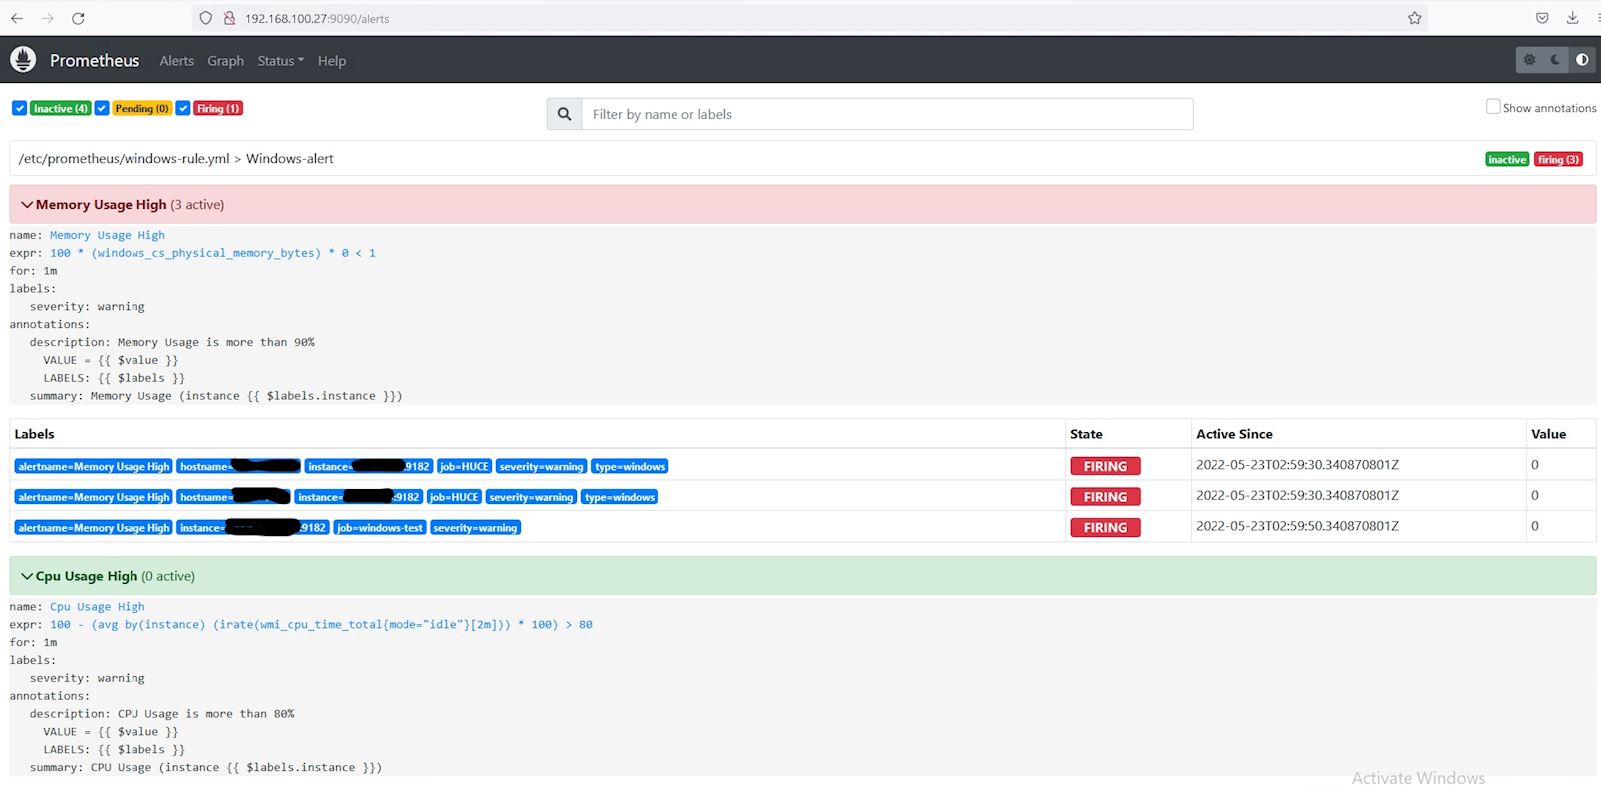
Nếu Prometheus đọc được Rule thì trên Web sẽ hiển thị như hình. Nếu 1 node nào đó đang giám sát mà thỏa mãn điều kiện thì rule sẽ được chuyển từ Inactive sang Pending, và sau cùng là Firing.
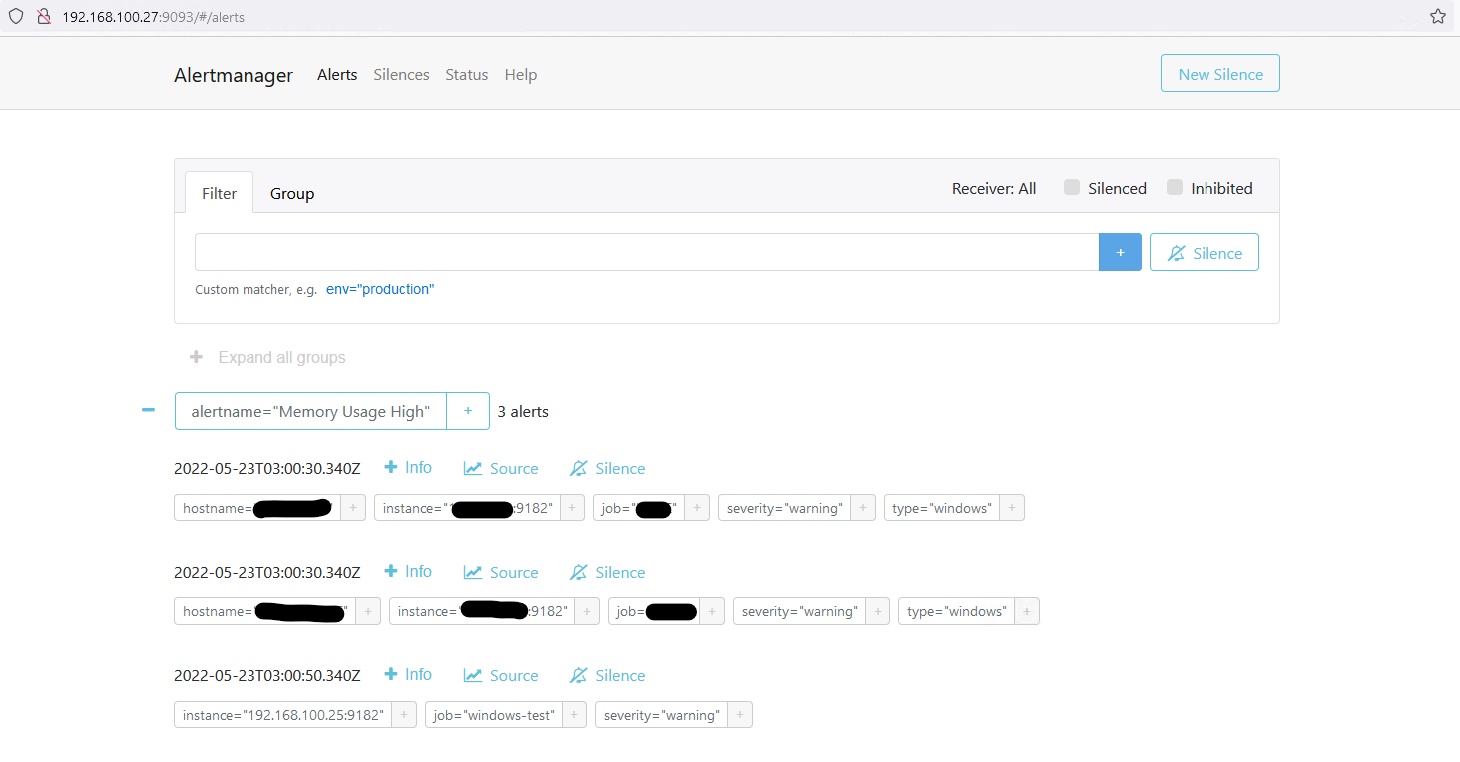
Nếu Firing được thì trên Alert Manager sẽ hiển thị như sau:
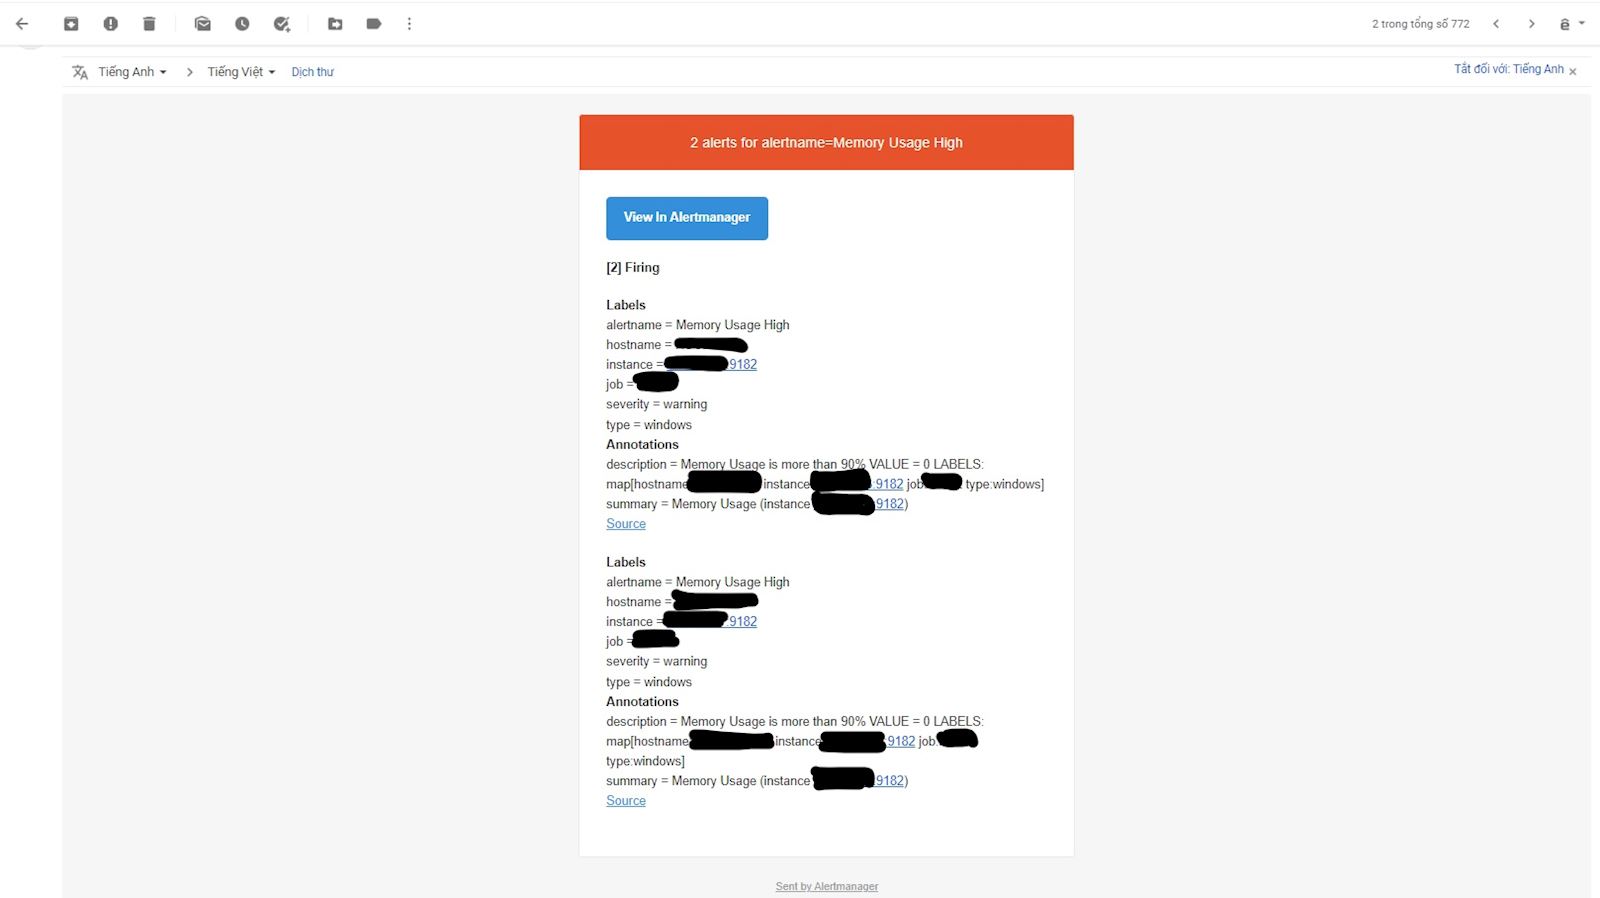
Đây là kết quả Alert Manager gửi về email:
Cần có kiến thức cơ bản về docker như image, container docker-compose, volumes, port, service,... và nắm được file mib, snmp, lệnh linux căn bản
OS: Centos 8
- Cài đặt Prometheus và Grafana
- Cài đặt SNMP Exporter (Prometheus) để giám sát các thiết bị mạng
- Cài đặt Alert Manager (Prometheus) để gửi mail khi có cảnh báo
1. Tổng quan
Các thiết bị mạng sẽ bắn ra các gói tin snmp.
Prometheus Server sử dụng Snmp Exporter để thu thập metrics qua các gói tin snmp nhận được, sau đó đẩy qua Grafana để hiển thị.
Network Device => SNMP Exporter => Prometheus Server => Grafana
Snmp Exporter là mã nguồn mở, dùng để cung cấp các gói SNMP theo định dạng Prometheus Server có thể hiểu được. SNMP Exporter sử dụng file snmp.yml để làm việc. Theo như SNMP Exporter thì không nên tạo hay chỉnh sửa file này bằng tay, mà phải dùng SNMP Exporter Generator để xuất ra. Để sử dụng SNMP Exporter Generator thì cần phải định nghĩa file generator.yml.
2. SNMP Generator
Pull image
docker pull snmp-generator
Tạo một thư mục nào đó (trong ví dụ này là /etc/snmp_exporter), rồi tạo file generator.yml và 1 thư mục mibs. Thư mục mibs này sẽ chứa các file mib để SNMP Generator sử dụng.
Điền nội dung vào file generator.yml. Ví dụ dưới đây sử dụng snmp version 2, cho thiết bị Cisco. Phần Community phải để ý chỉnh sửa.
modules:

########### Cisco. Module name là cisco

  cisco:

#   walk: [sysUpTime, interfaces, ifXTable]

   walk:

   - 1.3.6.1.2.1.2.2.1.1

   - 1.3.6.1.2.1.2.2.1.2

   - 1.3.6.1.2.1.2.2.1.10

   - 1.3.6.1.2.1.2.2.1.13

   - 1.3.6.1.2.1.2.2.1.14

   - 1.3.6.1.2.1.2.2.1.16

   - 1.3.6.1.2.1.2.2.1.19

   - 1.3.6.1.2.1.2.2.1.2

   - 1.3.6.1.2.1.2.2.1.20

   - 1.3.6.1.2.1.2.2.1.5

   - 1.3.6.1.2.1.2.2.1.7

   - 1.3.6.1.2.1.2.2.1.8

   - 1.3.6.1.2.1.31.1.1.1.1

   - 1.3.6.1.2.1.31.1.1.1.18

   - 1.3.6.1.4.1.9.9.48.1.1.1.5

   - 1.3.6.1.4.1.9.9.48.1.1.1.6

   - 1.3.6.1.2.1.1.5

   lookups:

     - source_indexes: [ifIndex]

       lookup: ifAlias

     - source_indexes: [ifIndex]

       lookup: ifDescr

     - source_indexes: [ifIndex]

       # Use OID to avoid conflict with Netscaler NS-ROOT-MIB.

       lookup: 1.3.6.1.2.1.31.1.1.1.1 # ifName

   version: 2

   max_repetitions: 25

   retries: 3

   timeout: 10s

   auth:

    community: dhxd
3. File mibs
Có thể download như trong hướng dẫn trên github của SNMP Exporter, sau đó đưa vào thư mục mibs.
Nếu trong quá trình sinh file snmp.yml bị lỗi, thì có thể làm theo hướng dẫn Building và Running trên github của SNMP Exporter để lấy file mibs khác. (Người viết đã dính lỗi này, cụ thể là snmp generator cannot find oid to walk)
Building
Due to the dynamic dependency on NetSNMP, you must build the generator yourself.
# Debian-based distributions.
sudo apt-get install unzip build-essential libsnmp-dev p7zip-full # Debian-based distros
# Redhat-based distributions.
sudo yum install gcc gcc-g++ make net-snmp net-snmp-utils net-snmp-libs net-snmp-devel # RHEL-based distros

go get github.com/prometheus/snmp_exporter/generator
cd ${GOPATH-$HOME/go}/src/github.com/prometheus/snmp_exporter/generator
go build
make mibs
Running
export MIBDIRS=mibs
./generator generate
4, Sinh snmp.yml
docker run -ti -v "${PWD}:/opt/" snmp-generator generate
Nếu chạy thành công sẽ sinh ra file snmp.yml nằm ngang cấp với generator.yml và mibs.
5. prometheus.yml
Cập nhật file với nội dung bên dưới, để scrape được thông tin được SNMP Exporter xuất ra. Cần để ý điền các Target là IP của thiết bị mạng, và Replacement là IP của máy host SNMP Exporter
  - job_name: snmp

    scrape_interval: 5s

    static_configs:

      - targets:

          - "10.0.0.17"

    metrics_path: /snmp

    params:

      module: [cisco]

    relabel_configs:

      - source_labels: [__address__]

        target_label: __param_target

      - source_labels: [__param_target]

        target_label: instance

      - target_label: __address__

        replacement: 192.168.100.27:9116 # địa chỉ IP của máy host
6. docker-compse.yml
Copy file snmp.yml vừa sinh vào thư mục /etc/prometheus-docker/snmp_exporter. SNMP Exporter sẽ sử dụng file này. Sau đó cập nhật file docker-compse để start SNMP Exporter
  snmp-exporter:

    image: prom/snmp-exporter

    user: "0"

    volumes:

      - /etc/prometheus-docker/snmp_exporter:/etc/snmp_exporter

    ports:

      - 9116:9116
Sau đó chạy cả stack
docker-compose up -d
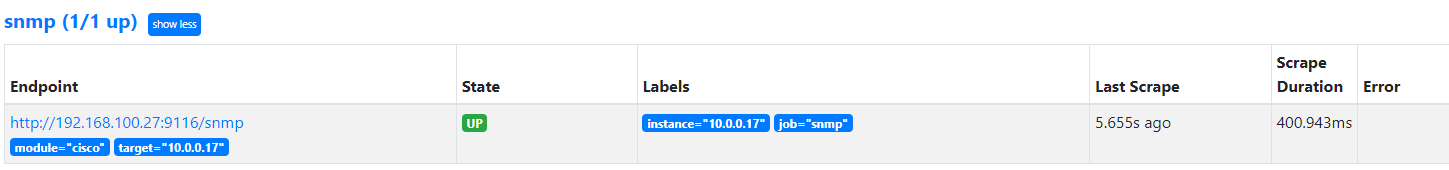
Chạy xong thì kiểm tra [IP]:9116, hoặc vào Prometheus Server > Target để kiểm tra. Nếu thành công thì sẽ hiển thị như bên dưới:
7. Grafana
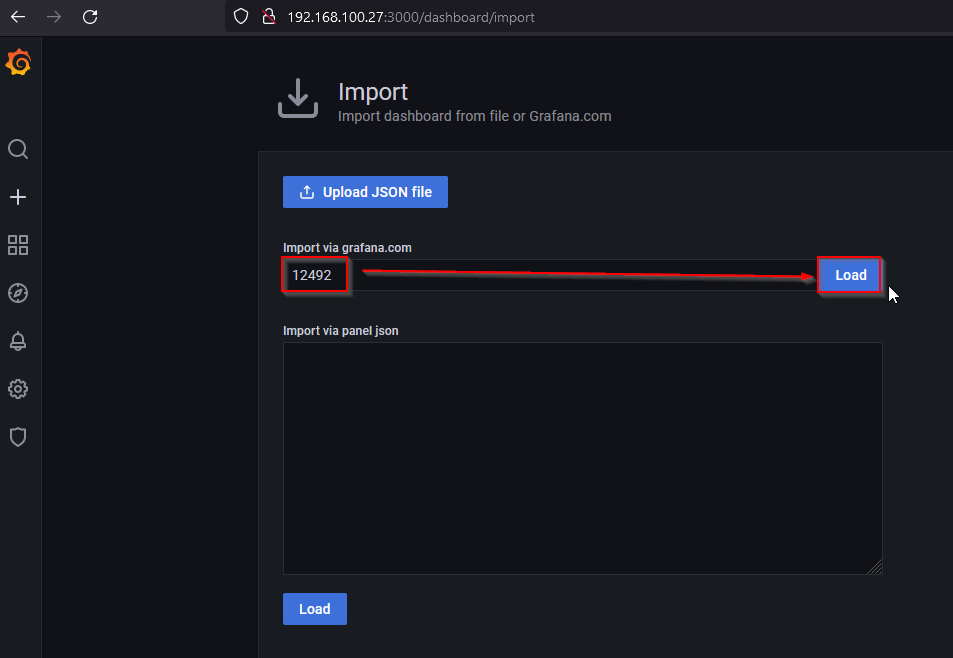
Truy cập https://grafana.com/grafana/dashboards/ và tìm mã dashboard thích hợp.
Nếu không có dashboard nào ưng ý thì có thể tự tùy biến thêm. Trong ví dụ đã tìm được 2 mã 12492, 3159.
Các hình dưới đây minh họa cho việc import dashboard
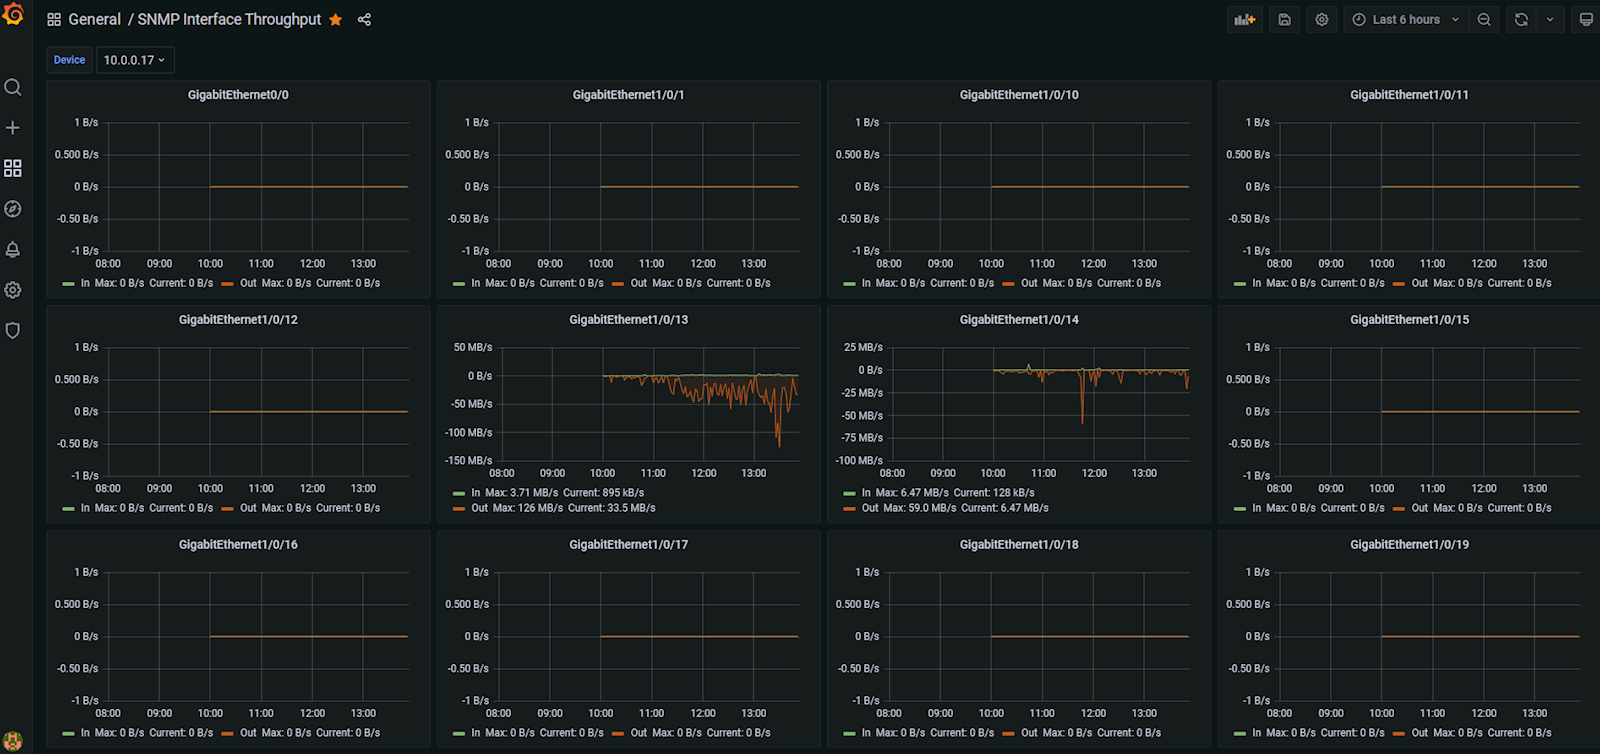
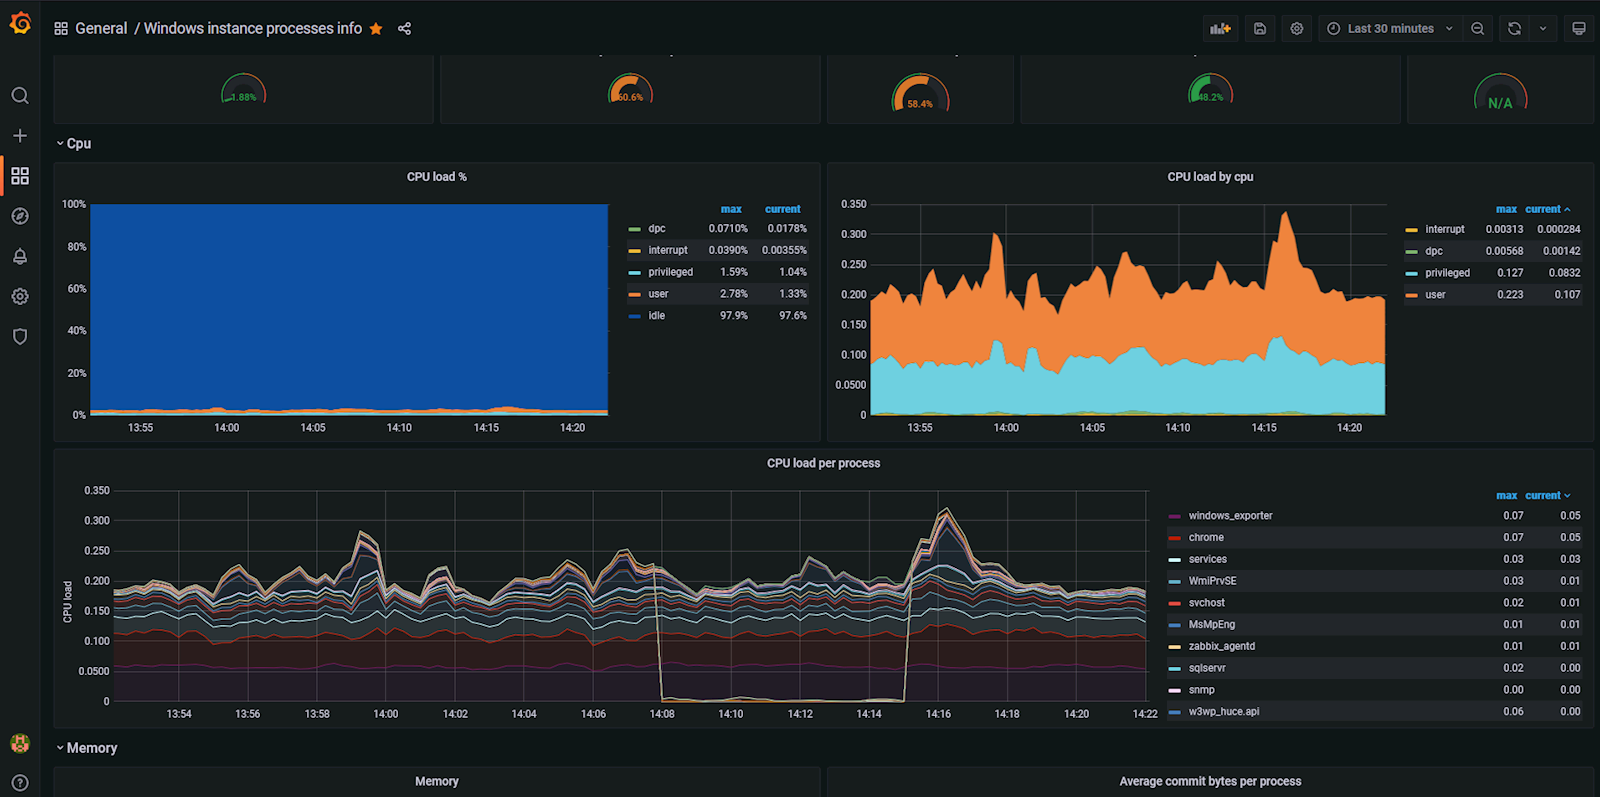
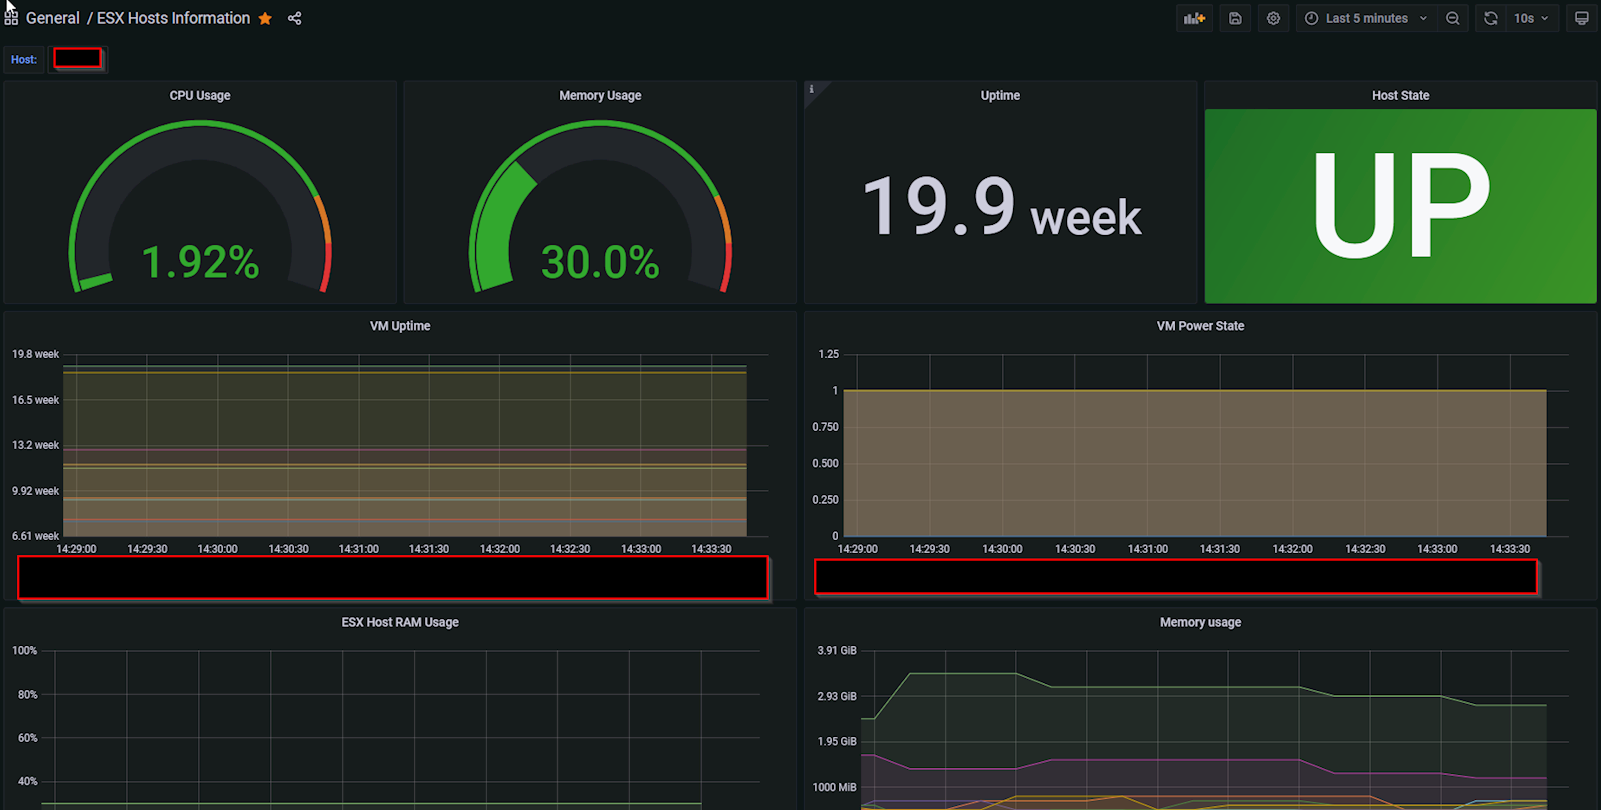
8. Kết quả
Vào grafana xem dashboard vừa tạo